
Version 0.9.38
Dov Grobgeld
Homepage: http://giv.sourceforge.net/giv
Development: http://github.com/dov/giv
Chat room: Gitter Giv Chat room
dov.grobgeld@gmail.com
Last modified: 2024-05-12 Sun

giv is an image viewer with the following features:
- Based on the gtk_image_viewer gtk widget (included), which provides small-memory and zoomable view of images.
- Support for 8-bit, 16-bit, 32-bit, and floating point gray and color images.
- Plugin support for external loaders.
- Support for multi-slice images. E.g. fits
- Includes plugins for reading the npy-format, FITS-format, and DICOM.
- An interactive contrast tool allows interactively changing contrast and brightness.
- It can display lines and marks on top of an image with sub pixel accuracy.
- Very fast overlay rendering through the free software library agg, which allows for easily showing hundreds of thousands of overlay points.
- Balloon popups can be tied to any overlay and is shown when the mouse hovers above that overlay.
- Pseudo coloring of gray level images.
- It is especially suited for computational geometry and vision scientific and educational applications.
- Hierarchical layering of data sets that can be turned on and off.
- Measuring distance in image through a caliper tool.
- Export and print to png, svg, postscript, and pdf thanks to cairo.
- Cross platform on posix and Windows through gtk-3.
Images are loaded through gdk_pixbuf and through additional image loaders. The image may be scrolled and zoomed with the mouse or the keyboard.Here is an example of the image display:
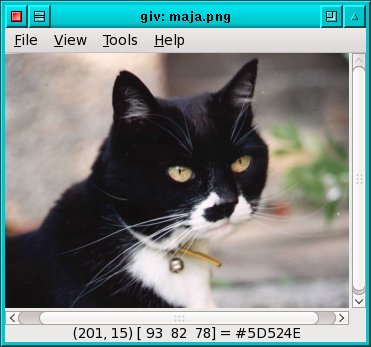
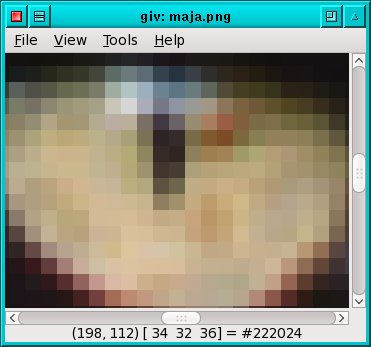
Normal scale Zoom in
giv has the cabability to read files describing vector annotations that are drawn on top of the image, or make up a drawing on their own. The annotations are loaded in file known as giv files. The giv files contains one or more data sets. A data set consists of properties, followed by a list of data points.A few of the properties are global and they effect not only the dataset but the entire display, e.g. the $image, and the $vflip.
The properties all start with the $ sign. Here is a list of all the properties supported:
Property Example Description $color $color pink3. The color of the data set (See color section below). If the color has a trailing "/num" then it is considered to be the alpha transperancy of the color. $outline_color $color green The outline color of a polygon $noline $noline Indicates that the no lines should be drawn for the data set. $line $line Lines should be drawn for the data set (default). $marks $marks circle The type of the mark. Valid marks are:
- circle
- fcircle
- square
- fsquare
$svgmarks $svgmarks drop.svg Reference an external svg file as a marker. $hide $hide Initially hide the dataset. It may be turned on by the marks viewer. $scale_marks $scale_marks Indicates whether the marks should be scaled together with the image. Default is not to scale. $linedash $linedash 10 5 Specifies that lines should be drawn with dashes. The numbers indicate the dash and the spacing size. There may be multiple pairs, indicating sequential shapes. $mark_size $mark_size 15 Specify the size of the marks in pixels. $lw $lw 3 Line width. This also affects the width of the outline marks (e.g. circle and square). $image $image maja.pgm Reference image to be shown below the image. Several images lines may be given. The user may rotate between the different images through the shift-Up and shift-down key bindings. $arrow $arrow start Indicate that arrows should be added to the lines. Arrows may be drawn at the start, of the line, the end of the line, or both by giving the keywords "start", "end", "both" after $arrow. $font $font Monospace 24 Font to be used for drawing text. The name of the font is according to requirements of pango font string representation. $text_style $text_style shadow The style used to draw the text. The only valid style is "shadow". $shadow_color $shadow_color black/0.3 For the shadow style, the color of shadows. $shadow_offset $shadow_offset 1 1 For the shadow style, the x and y offsets of the shadow. $pango_markup $pango_markup Indicates that the text should be interpreted as a pango markup string. See: http://developer.gnome.org/pango/stable/PangoMarkupFormat.html $scale_font $scale_font 1 Indicates that the text should be scaled with the current zoom level. Default is not to zoom up text. $balloon $balloon Suspect Adds another line to the popup balloon that is shown when the balloon popups have been turned on (in the view menu) and the mouse hovers over the dataset. $polygon $polygon Indicates that the dataset should be filled. $def_style $def_style Ref $color green Add an additional property to a style. (See style section) $style $style Ref Imports all dataset properties from the namedo style. This is simply a shortcut to explicitely writing all style properties. $path $path reference/pads Creates a hierarchical name of the dataset that will be used in the dataset browser. Each slash indicates another branch in the hierarchy tree. $quiver_color $quiver_color green The color of a quiver arrow $quiver_scale $quiver_scale 100 The original scale of the quiver plot $vflip $vflip Flip the vertical axis of the marks and images. $novflip $novflip Turn off the vertical flip. $hflip $hflip Flip the horizontal axis of the marks and images. $nohflip $nohflip Turn off the horizontal flip. $vlock $vlock Lock the vertical axis zoom. Useful e.g. for exploring time plots. $title $title Set the window title. $pixelsize $pixelsize 5 µm Set the pixelsize for the measurement tool
After the header of the dataset, follows its data points. giv follows the SVG model of drawing curves. A line is composed of a letter followed by the coordinates. By default the action is lineto, but the following are also supported:
Letter Meaning Number parameters Comment M move to 2 Implicit for first point L line to 2 Optional Z line to 2 Close path C curve to 6 A cubic Bezier R quadratic curve to 4 A cubic Bezier
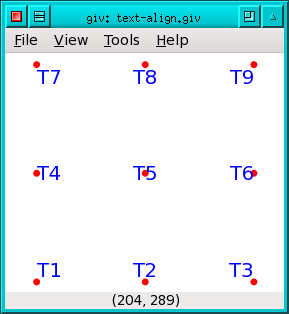
Text is drawn by adding the letter "T" in front of a line. The "T" may have a number 1-9 appended describing the anchoring of the text. This numbers corresponds to their position on the numerical keyboard. The default alignment is 1, i.e. lower left. To write multiline text add string "\n".The following example illustrates the various anchor options.
text-align.giv The following screenshot shows the various alignments relative to the anchor points.
The encoding of giv files is always utf8. Bidi is supported through pango.
The backslash character is used as an escape character, so to get a literal backslash two slashes must be used. "\n" is used to indicate aline break.
For all the properties that take colors as arguments the color may be given in several ways:Here are some valid color names:
- As a string name according to the X11 color names.
- As a hexstring in the format #rrggbb.
- It may have an optional slash followed by an alpha value between 0 and 1.
- green/0.5
- #ff0000
Instead of explicitly listing all properties for a dataset, this may be done inderectly by the creation of a style. A style is created and has properties added to it through the $def_style keyword. Each use of $def_style adds one property to the style. A style is then referenced in the beginning of a dataset with the $style keyword followed by the style name.
style-ex.giv
Here is an extensive giv file example showing off the various features of giv. The result is shown in the screenshow below.
example.giv
Note: The example above contains just a few points. Giv very easily supports several hundred thousand points. The only limitations are the physical memory and the speed of the CPU.
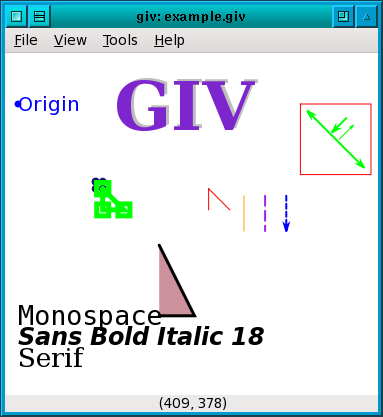

Marks at default zoom Marks zoomed in. The balloon popup has been turn on.
Option Description 1 Sets one image pixel equal to one screen pixel. a Toggle anti aliasing b Toggle the balloon popup. c Reduce contrast. Useful for viewing overlay on binary images. i Show information window f Fill data to window g Toggle the pixel grid. (Only shown at high zoom ratios). h Horizontal flip m Toggle overlay. o Popup dataset browser. q Quit s Shrink wrap v Vertical flip Shift-V Toggle vertical zoom locking. Control+c Copy contents of balloon text to clip board Control+d Copy contents of the last measurement to the clipboard. Control+x Copy XY coordinate to the to clip board Esc Abort remote command pick points =
Ctrl-B1Zoom in by a factor of 2 -
Ctrl-B3Zoom out by a factor of 2 Scroll wheel up Zoom in by a factor of 1.4 Scroll wheel down Zoom out by a factor of 1.4 Shift+Scroll wheel up Zoom in by a factor of 1.1 Shift+Scroll wheel down Zoom out by a factor of 1.1 Control+Scroll wheel up Zoom in by a factor of 2 Control+Scroll wheel down Zoom out by a factor of 2 Alt + Scroll wheel up Zoom in of quiver vectors by a factor of 1.2 Alt + Scroll wheel down Zoom out of quiver vectors by a factor of 1.2 B3 Popup options menu. Left/Space Show next image in directory. Right/BackSpace Show previous image in directory. Shift-Down Choose next image when several $image references are given or next image for multi depth images. Shift-Up Choose previous $image image

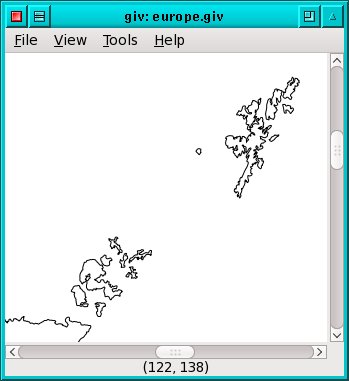
A heavy dataset from the CIA world map data of Europe comprising more than 400,000 vector elements.
Zoom-in of Shetland and Orkney islands off the coast of Scotland.


The result of a contour finding algorithm shown on top of the image. The overlay may be toggled by the key 'm'.
Zoom in of image shows contour sub pixel accuracy.
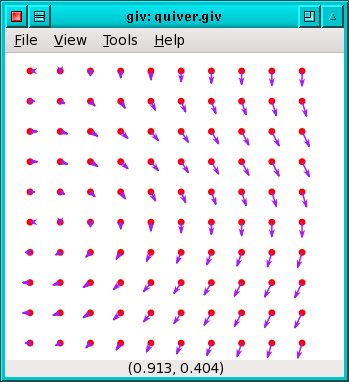
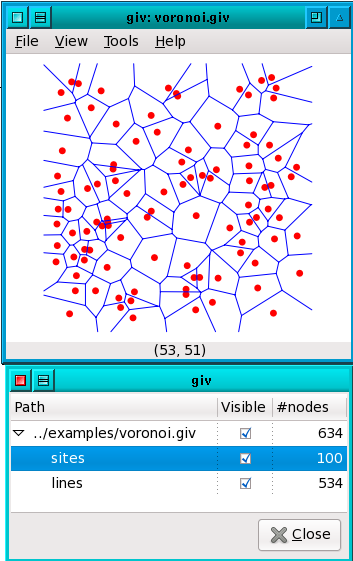
A quiver plot. giv showing a Voronoi diagram. The dataset browser is also shown.
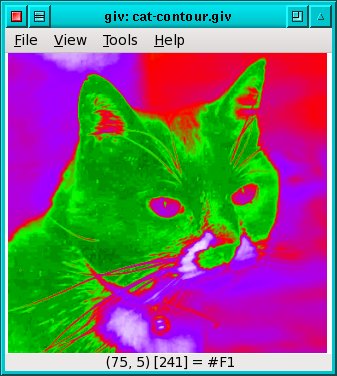
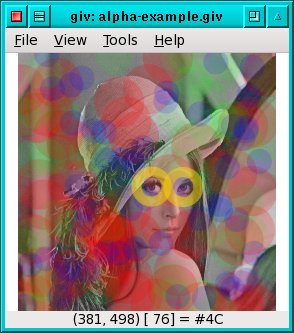
Pseudo color A gray level image with transparent overlay 
Example use of svgmarks
where the markers are read from an
external svg file.The Contrast Tool with a 16-bit image
Dicom XRay image of a
pregnant bitch
After contrast stretching and coloring
The measurement caliper and the calibration tool
| pick-coordinate.py |
|---|
  1:  #!/usr/bin/python
  2:  import httplib,json
  3:
  4:  conn = httplib.HTTPConnection('localhost:8448')
  5:
  6:  request = {'method':"pick_coordinate",
  7:             'params':[]}
  8:
  9:  conn.request("POST", url='', body= json.dumps(request))
 10:  response = json.loads(conn.getresponse().read())
 11:  if 'error' in response:
 12:    print response['error']['message']
 13:  else:
 14:    print response['result']
15: |
giv also contains an embedded JSONRPC client that come in two forms, the simplified and the full forms.
The simplified form splits the arguments on whitespace and takes the first argument as the name of the remote method and the rest as the parameters.
giv --remote "load_file /home/dov/pictures/maja.pgm"The full forms allows specifying the parameters in json syntax. The following command is equivalent to the above code:
./giv --json_method load_file -json_params '["/home/dov/github/giv/examples/lena.pgm"]'
For windows there is a command line tool called giv-remote-client.exe that provides a simple remote client:
giv-remote-client.exe load_file "c:/Program Files/Giv/examples/lena.pgm"
Here is a list of possible future development. The direction taken depends on user feedback!
- Create loaders for HDF5.
- Create a property window to show meta data. E.g. data from a dicom file.
- Speed up dealing with huge datasets.
- Create a measuring tool for measuring areas, histograms, etc.
- Create a man page